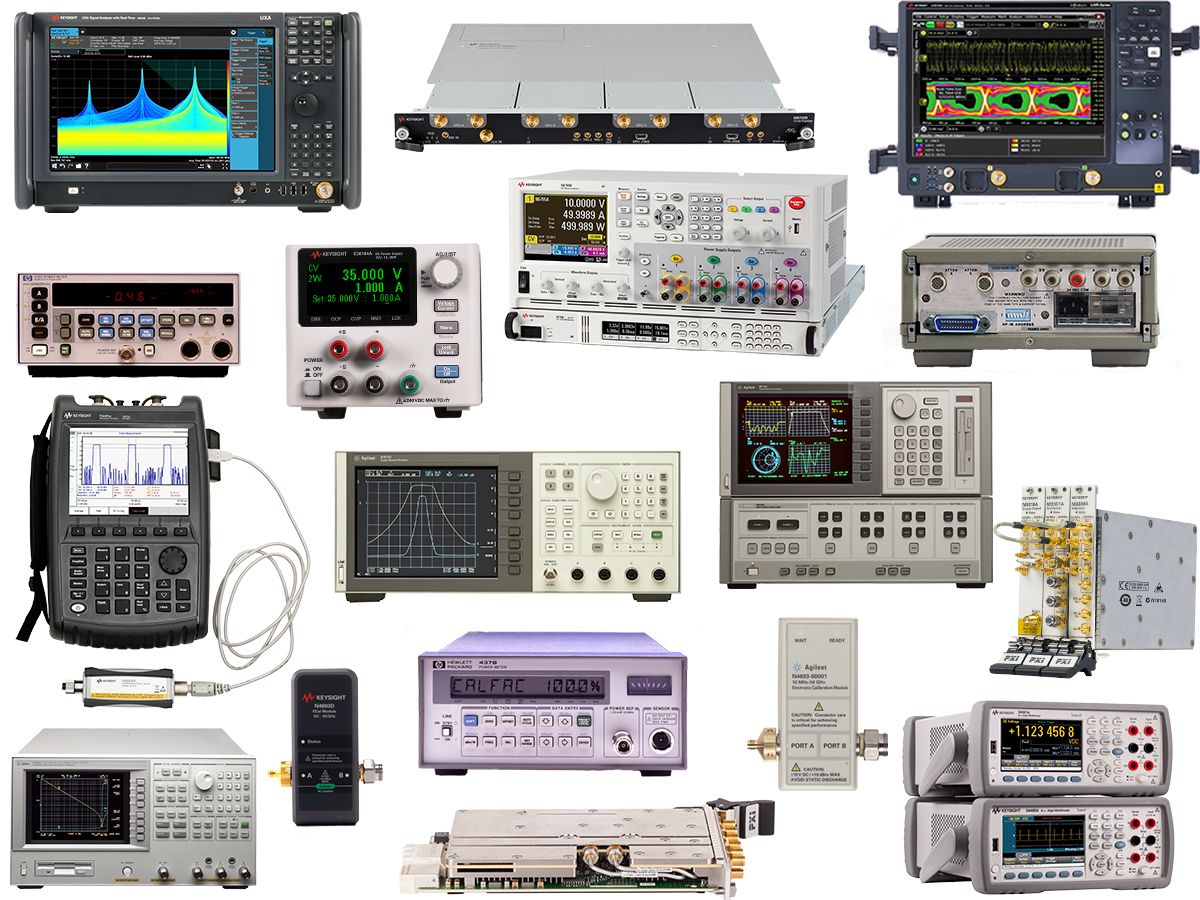
Agilent / HP / Keysight 16530A
16530A DIGITIZING OSCILLOSCOPE TIMEBASE CARD
Description
This unit is a graph- device, it draws a graph of an electrical signal.
In most applications, the graph shows how signals change over time, the vertical (Y) axis represents voltage and the horizontal (X) axis represents time.
The intensity or brightness of the display is sometimes called the Z axis.
This oscilloscope's simple graph can tell you many things about a signal, such as, the time and voltage values of a signal, the frequency of an oscillating signal, the moving parts of a circuit represented by the signal, the frequency with which a particular portion of the signal is occurring relative to, other portions, whether or not a malfunctioning component is distorting the signal, how much of a signal is direct current (DC) or alternating current (AC) and how much of the signal is noise and whether the noise is changing with time.
Key Points
TTL/ECL presets scaling
Events Delay Trigger
Auto pulse parameters
Time between markers
Statistical analyses
Averaged waveform display
Lightweight, miniprobes
Performance Char
Specifications
Form Factor: Module
Bandwidth: 100MHz
Number of Channels: 2Ch
Simultaneous Channels: 8Ch
Simultaneous Maximum Sampling Rate/ch: 400MSa/s
Max. Single Shot bandwidth : 100MHz
Number of Bits : 6bits
Maximum Input Voltage : 40Vrms
Trigger Sensitivity : -20mV


